Predict View
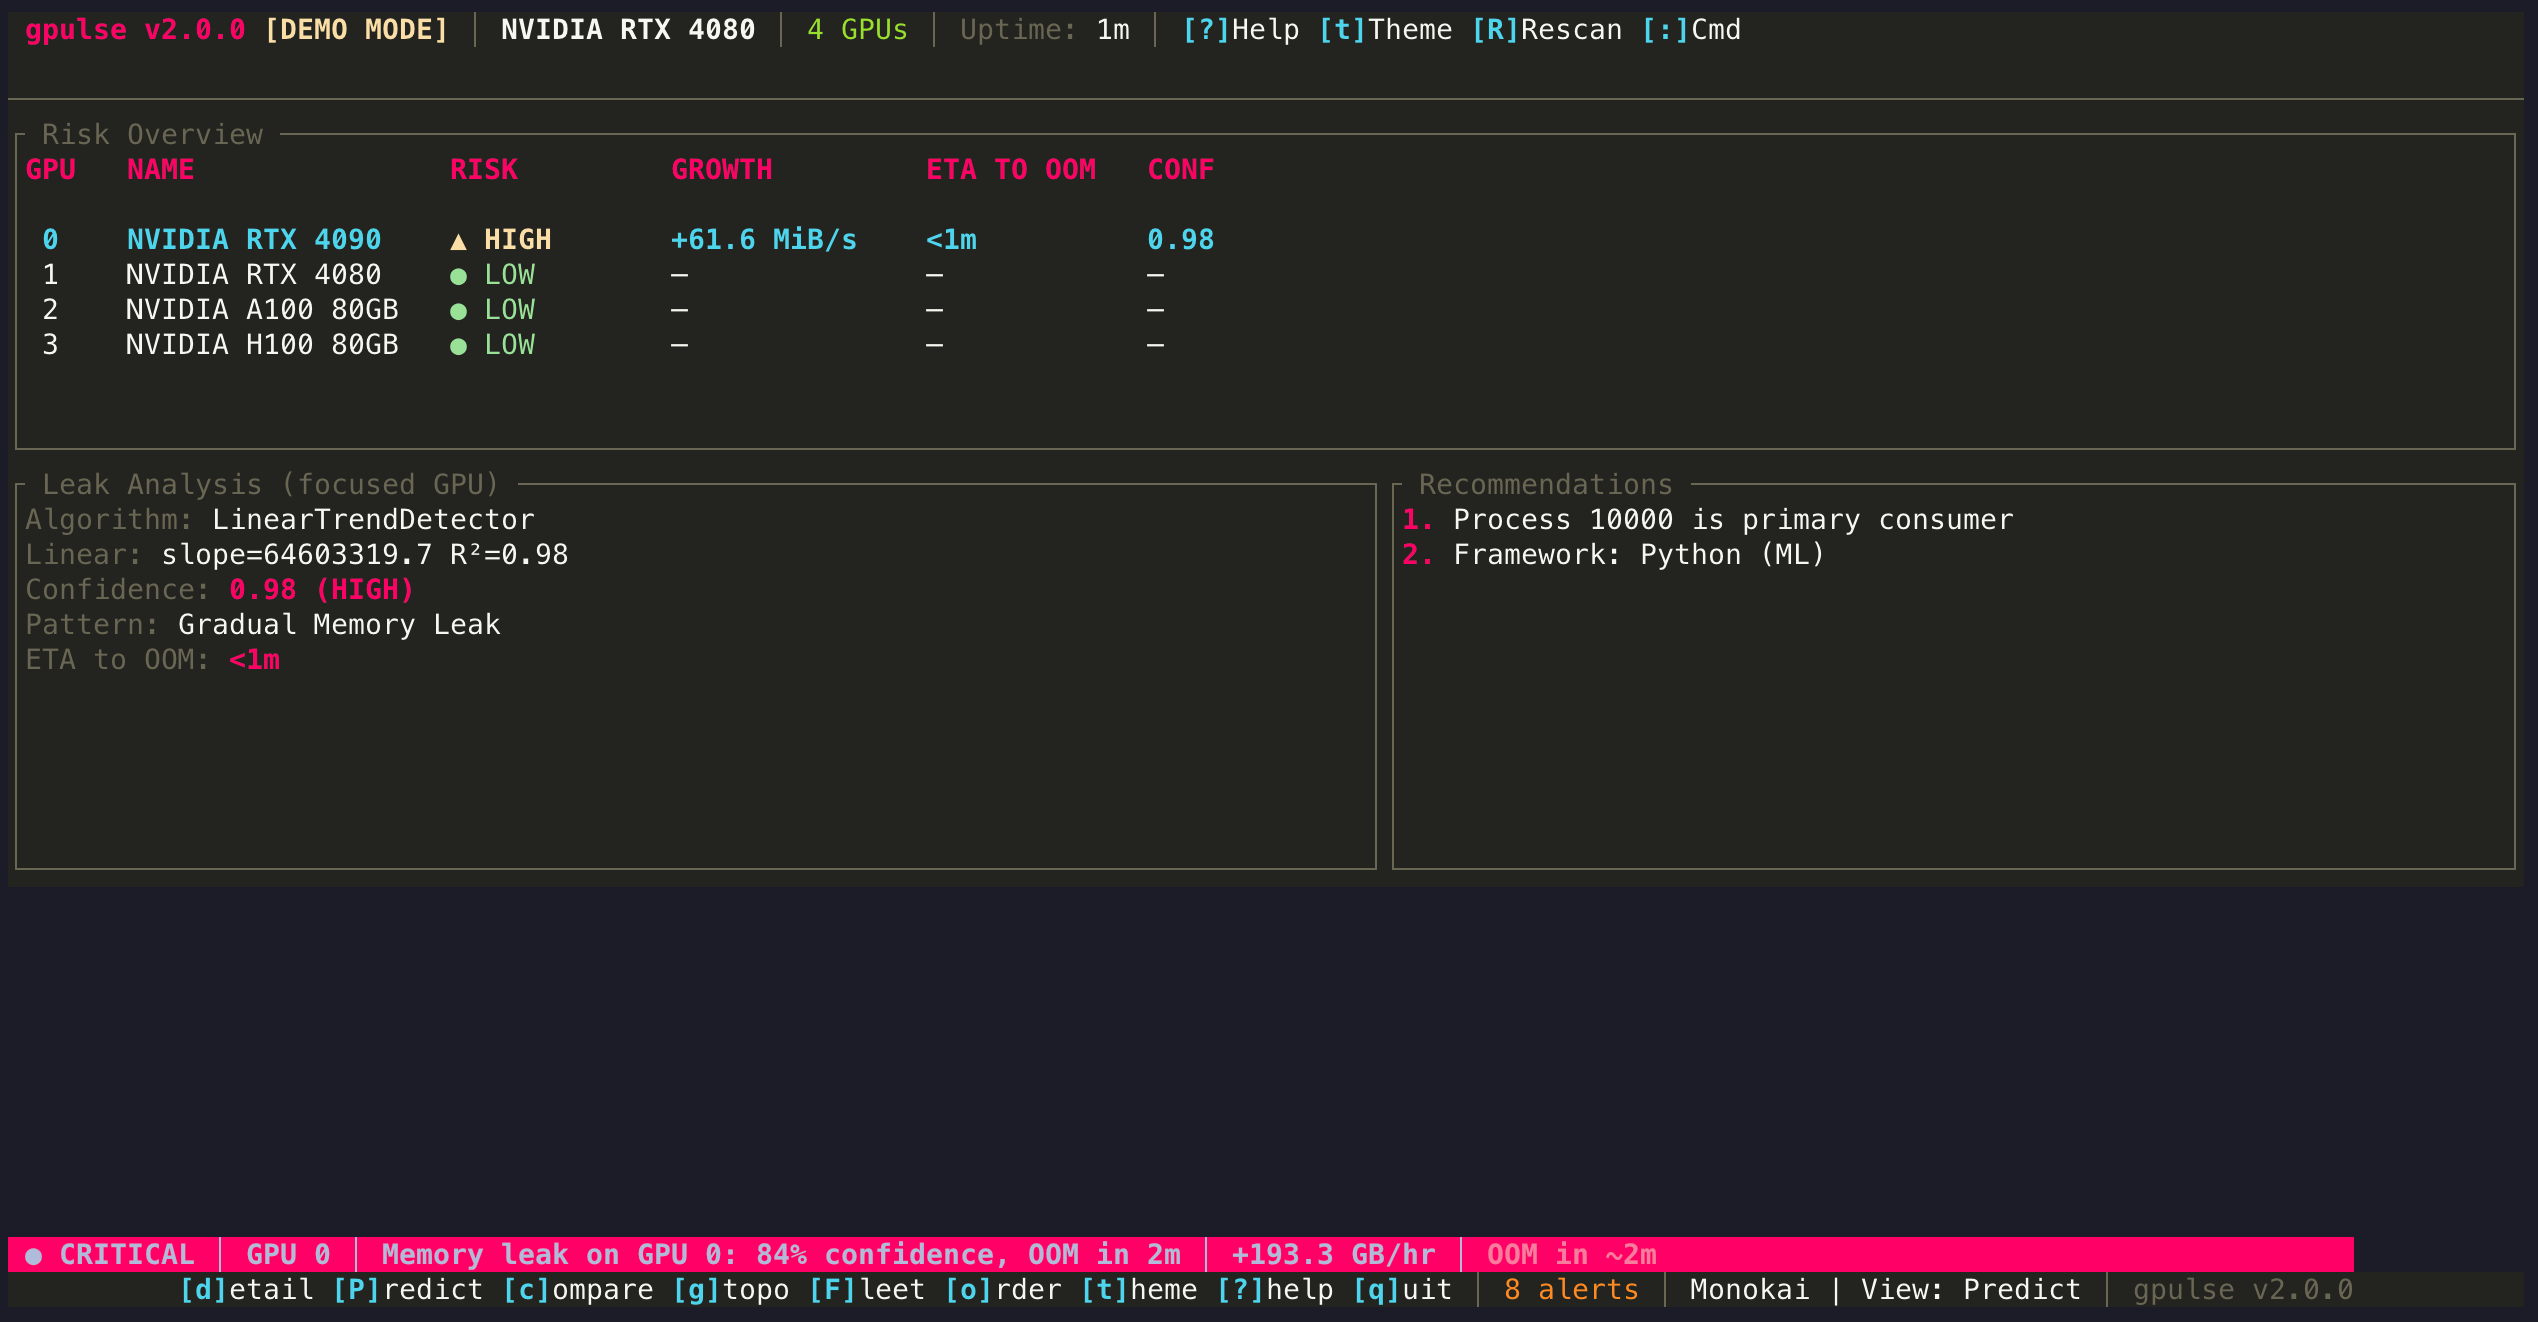
The heart of gpulse's differentiator. Predict view runs leak detection algorithms against memory history and shows time-to-OOM estimates, growth rates, and confidence scores.
Press P (uppercase) from any view to enter Predict mode.
What You See
Predict view is divided into several panels:
Risk Overview Table
A summary row per GPU showing:
- Risk Level — LOW / MEDIUM / HIGH / CRITICAL, color-coded
- VRAM Usage — current usage and percentage
- Growth Rate — memory increase per unit time (e.g., 12.4 MB/min)
- ETA to OOM — estimated time until memory runs out, or "Stable" if no leak detected
- Confidence — statistical confidence of the detection (0-100%)
- Detector — which algorithm flagged the issue (Linear, Spike, Composite)
Detection Detail Panel
For the selected GPU, a detailed breakdown showing:
- Algorithm Used — LinearTrendDetector, SpikeDetector, or CompositeDetector
- R-squared (R²) — how well the linear regression fits the memory data (0.0 = no fit, 1.0 = perfect fit)
- Slope — rate of memory growth in bytes per second
- Pattern Type — Gradual Leak, Sudden Spike, Cyclic, Step Increase, or Unknown
- Framework Detected — PyTorch, TensorFlow, JAX, Ollama, MLX, or Unknown
- Suspected Process — the process most likely responsible for the leak
Memory History Sparkline
A compact chart showing memory usage over the analysis window. The trend line is overlaid when a leak is detected, making the growth pattern visually obvious.
Reading the Output
Growth Rate
How fast memory is increasing, displayed in human-readable units (KB/s, MB/min, GB/hr). A positive growth rate does not always mean a leak — some workloads legitimately grow over time. Cross-reference with R² to assess significance.
R² (R-squared)
A statistical measure of how well memory growth fits a linear trend. R² = 0.95+ suggests a genuine steady leak. R² = 0.5-0.8 suggests noisy or intermittent growth. R² < 0.5 is likely normal variation.
Confidence
A composite score (0-100%) combining R², growth rate significance, and pattern matching. The detection threshold defaults to 75% — only leaks above this confidence trigger a HIGH or CRITICAL risk rating.
ETA to OOM
Extrapolated time until VRAM is completely exhausted based on the current growth rate. Displayed as hours:minutes or "Stable" when no upward trend is detected. This is a projection — actual OOM time may vary if the workload changes.
Keyboard Shortcuts
| Key | Action |
|---|---|
| Tab / Shift+Tab | Select next / previous GPU in the risk table |
| a | Acknowledge an alert |
| A | View alert history |
| d | Switch to Detail view for selected GPU |
| v | Return to Grid view |
When to Use Predict View
Open Predict view when you are running long training jobs or inference servers and want to proactively detect memory leaks before they cause an OOM crash. It is especially valuable for overnight runs where you cannot manually monitor the terminal. For a deeper understanding of the detection algorithms, see Leak Detection.