Getting Started
Get gpulse installed and monitoring your GPUs in under five minutes.
System Requirements
| Requirement | Minimum |
|---|---|
| Operating System | macOS 12 (Monterey) or later |
| Processor | Apple Silicon (M1/M2/M3/M4) or Intel Mac |
| Memory | 4 GB RAM (8 GB recommended) |
| Terminal | Any terminal emulator (Terminal.app, iTerm2, Warp, Kitty, etc.) |
| Disk Space | ~10 MB for the binary |
gpulse also supports NVIDIA (via NVML), AMD (via ROCm), and Intel (via Level Zero) GPUs when running on compatible hardware. Linux support is coming soon.
Installation
Option 1: Homebrew (Recommended)
The fastest way to install. One command, no dependencies.
brew tap gpulseai/gpulse && brew install gpulseOption 2: Direct Download
Download the latest release binary directly.
# Download latest release for macOS (Apple Silicon)
curl -L https://github.com/gpulseai/gpulse/releases/latest/download/gpulse-darwin-arm64.tar.gz -o gpulse.tar.gz

# Extract and install
tar -xzf gpulse.tar.gz
sudo mv gpulse /usr/local/bin/
sudo chmod +x /usr/local/bin/gpulse
Option 3: Manual Install
Download the binary from the releases page and place it somewhere in your $PATH.
Verify Installation
gpulse --versionYou should see the version number, build date, and target architecture printed to your terminal.
First Launch
Launch the dashboard with a single command. No account required.
gpulse dashboard
On first launch, gpulse runs a quick 4-question onboarding wizard to configure your preferred theme, default view, refresh rate, and notification preferences. Your choices are saved to config.toml and applied automatically on every subsequent launch.
gpulse will automatically detect your GPU hardware and display the Grid view — a tile layout showing every GPU with real-time metrics.
Configuration
You can change your preferences at any time using the gpulse config command, which re-runs the onboarding wizard and updates your config.toml.
gpulse config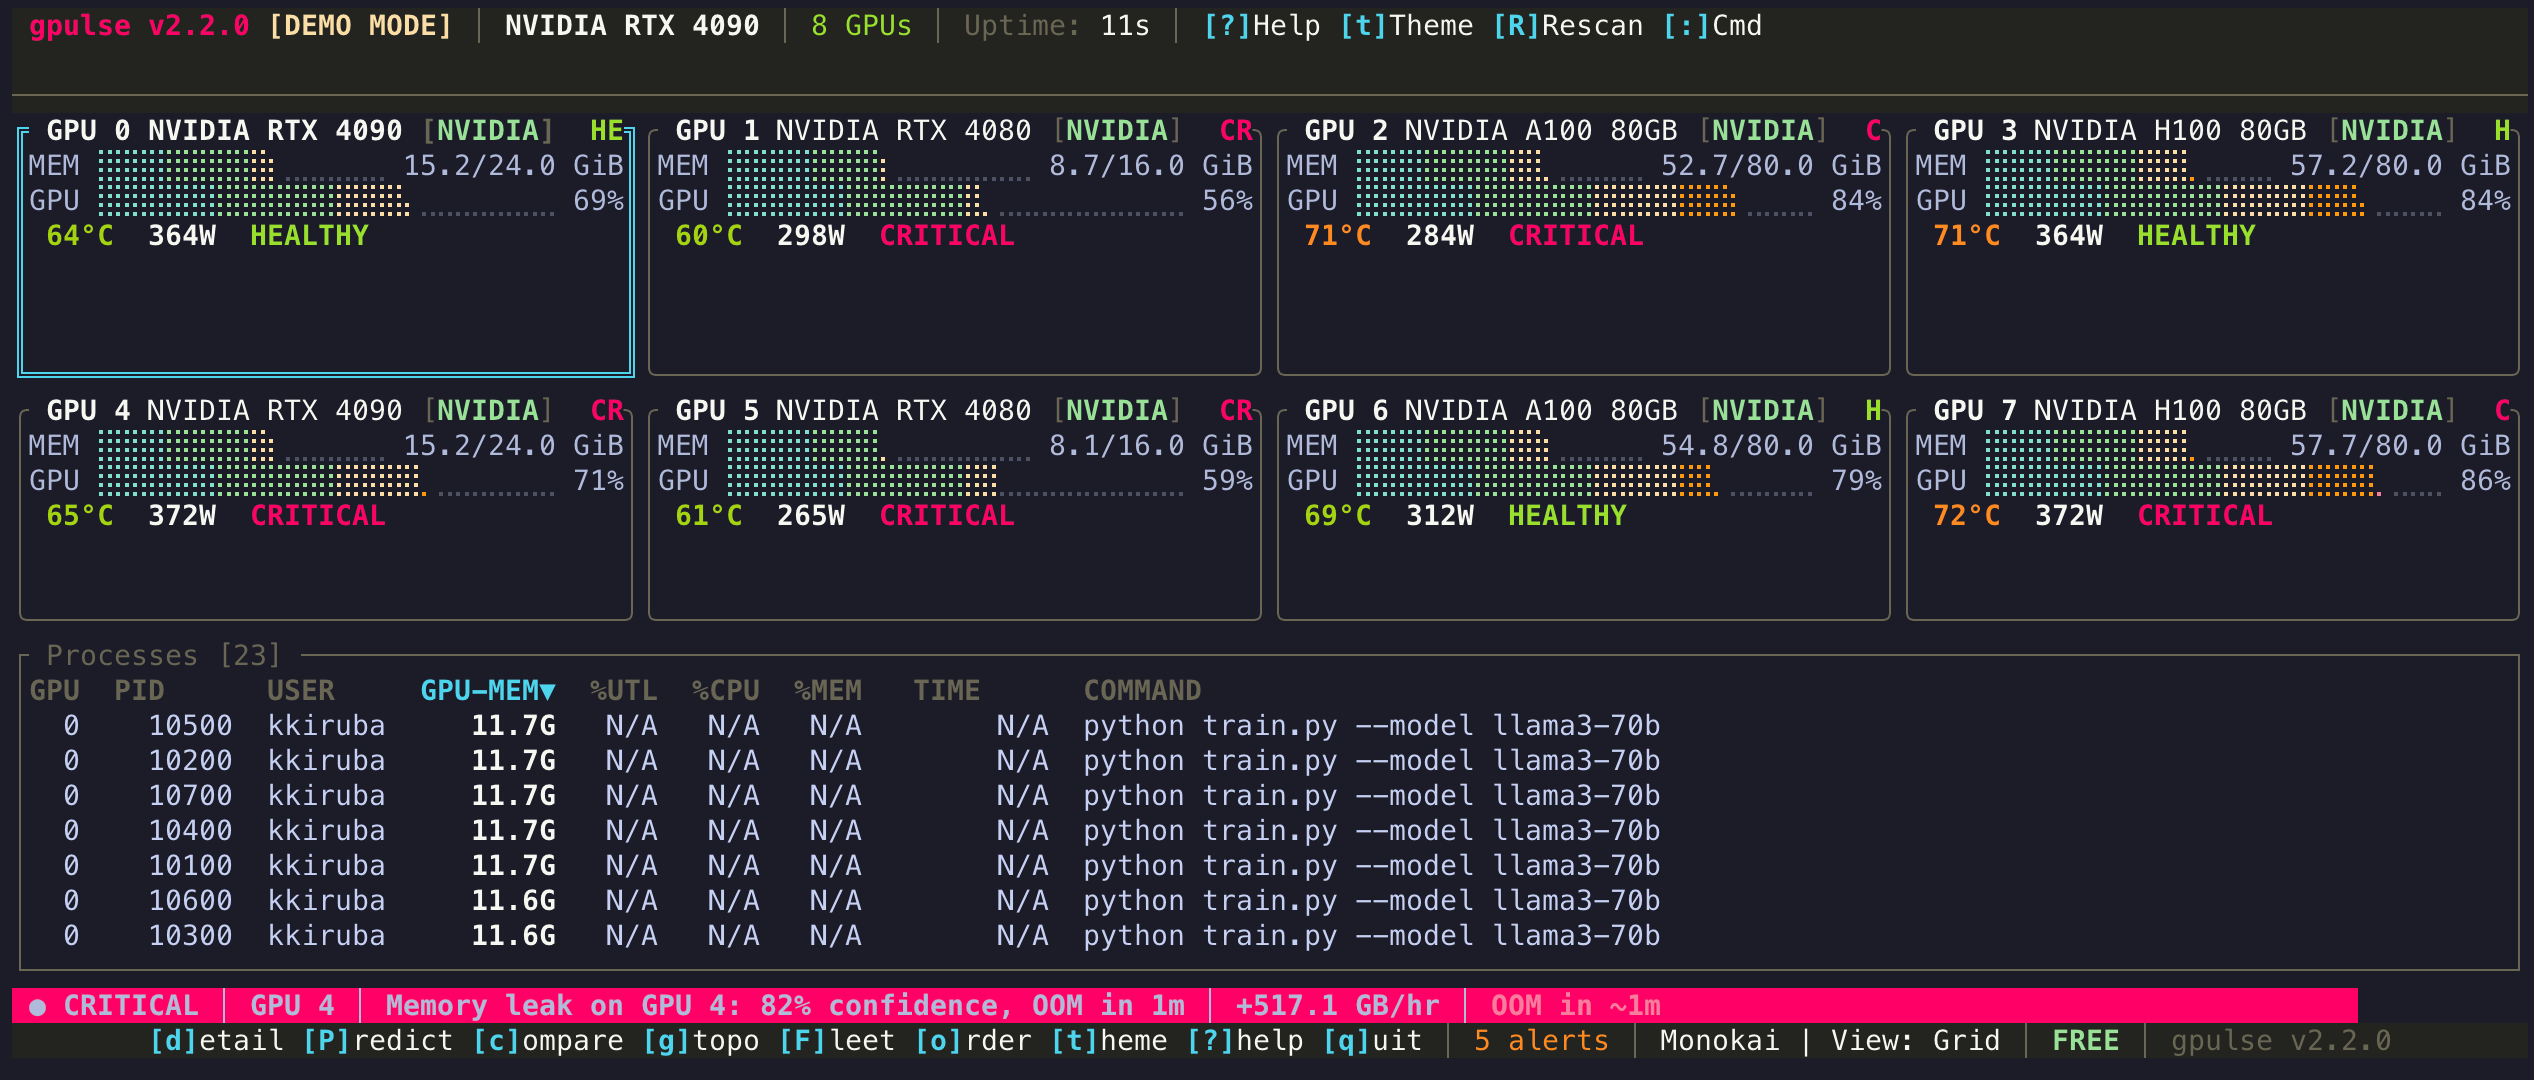
Demo Mode
Want to explore gpulse without real GPU hardware? Demo mode simulates GPUs with realistic workload data so you can try every view and feature.
# Simulate 4 NVIDIA GPUs with realistic workloads
gpulse dashboard --demo nvidia:4
You can also simulate different vendors: --demo apple:1, --demo amd:2, or mix them: --demo nvidia:2,apple:1.
Navigating Views
gpulse has seven view modes, each a single keystroke away. You never need to leave the terminal.
| Key | View | Purpose |
|---|---|---|
| v | Cycle Views | Rotate through Grid, List, and other views |
| d | Detail | Deep dive into the selected GPU |
| c | Compare | Side-by-side GPU comparison |
| g | Topology | GPU interconnect diagram |
| P | Predict | OOM prediction and leak detection |
| F | Fleet | Multi-machine monitoring (Pro) |
Understanding the Display
Every view shows a combination of the following GPU metrics. Here is what each one means:
VRAM Usage
How much video memory is currently allocated versus total available. Displayed as a bar graph with percentage and absolute values (e.g., 12.4 / 24.0 GB). Color shifts from green to yellow to red as usage increases.
GPU Utilization
Percentage of the GPU compute cores actively processing work. 0% means idle; 100% means every core is busy. Sustained 100% is normal during training — but if paired with rising VRAM, investigate.
Temperature
GPU die temperature in degrees Celsius. Typical ranges: idle 30-45C, load 60-85C. Above 90C may indicate thermal throttling. gpulse highlights temperatures with color thresholds.
Power Draw
Current power consumption in watts versus the power limit. Helps identify whether your GPU is power-limited or running below capacity.
Process Table
Lists every process using the GPU, sorted by memory. Shows PID, process name, GPU memory allocated, CPU utilization, and GPU utilization. Press s to change sort column, f to filter.
Getting Help
Press ? at any time to open the built-in help overlay. It shows all available keyboard shortcuts for your current view.
You can also open the command palette with : to search for commands by name.
Next Steps
- Explore View Modes to learn what each display offers
- Set up Leak Detection to get OOM predictions
- Browse Keyboard Shortcuts for the full keybinding reference
- Customize with Themes — 15 built-in color schemes