Leak Detection
gpulse's leak detection engine continuously analyzes GPU memory usage patterns and predicts out-of-memory events before they crash your workload. It uses three pluggable detection algorithms running in real time.
Detection Algorithms
gpulse ships with three detection algorithms. By default, the CompositeDetector runs both sub-algorithms and returns the highest-confidence result.
1. LinearTrendDetector
Performs least-squares linear regression on memory usage over time. If the slope is positive and the R² value exceeds the configured threshold, it flags a leak.
How It Works
Collects memory snapshots at the configured sampling interval. Fits a line y = mx + b where y is VRAM usage and x is time. The slope m is the growth rate. R² measures how well the data fits the line.
Best For
Gradual, steady memory growth typical of training loops with accumulating tensors, unreleased CUDA contexts, or growing optimizer state.
Default Thresholds
- Minimum R²: 0.7 (configurable)
- Minimum slope: 1 MB/s (configurable)
- Minimum analysis duration: 5 minutes
2. SpikeDetector
Detects sudden, large increases in memory usage within a sliding time window. Unlike the trend detector, it does not require a sustained linear pattern.
How It Works
Compares memory usage at the start and end of a configurable window (default: 30 seconds). If the increase exceeds the spike percentage threshold, it fires. Useful for catching allocation bursts.
Best For
Sudden allocation bursts during batch processing, model loading events, or resource exhaustion scenarios where memory jumps in large steps rather than growing linearly.
Default Thresholds
- Spike percentage: 20% increase
- Time window: 30 seconds
3. CompositeDetector
Runs both LinearTrendDetector and SpikeDetector in parallel, then returns the result with the highest confidence score. This is the default detector.
Why Use Composite
You do not need to know what kind of leak you are looking for. The composite approach catches both gradual leaks and sudden spikes with a single configuration. It is the recommended default for unknown or heterogeneous workloads.
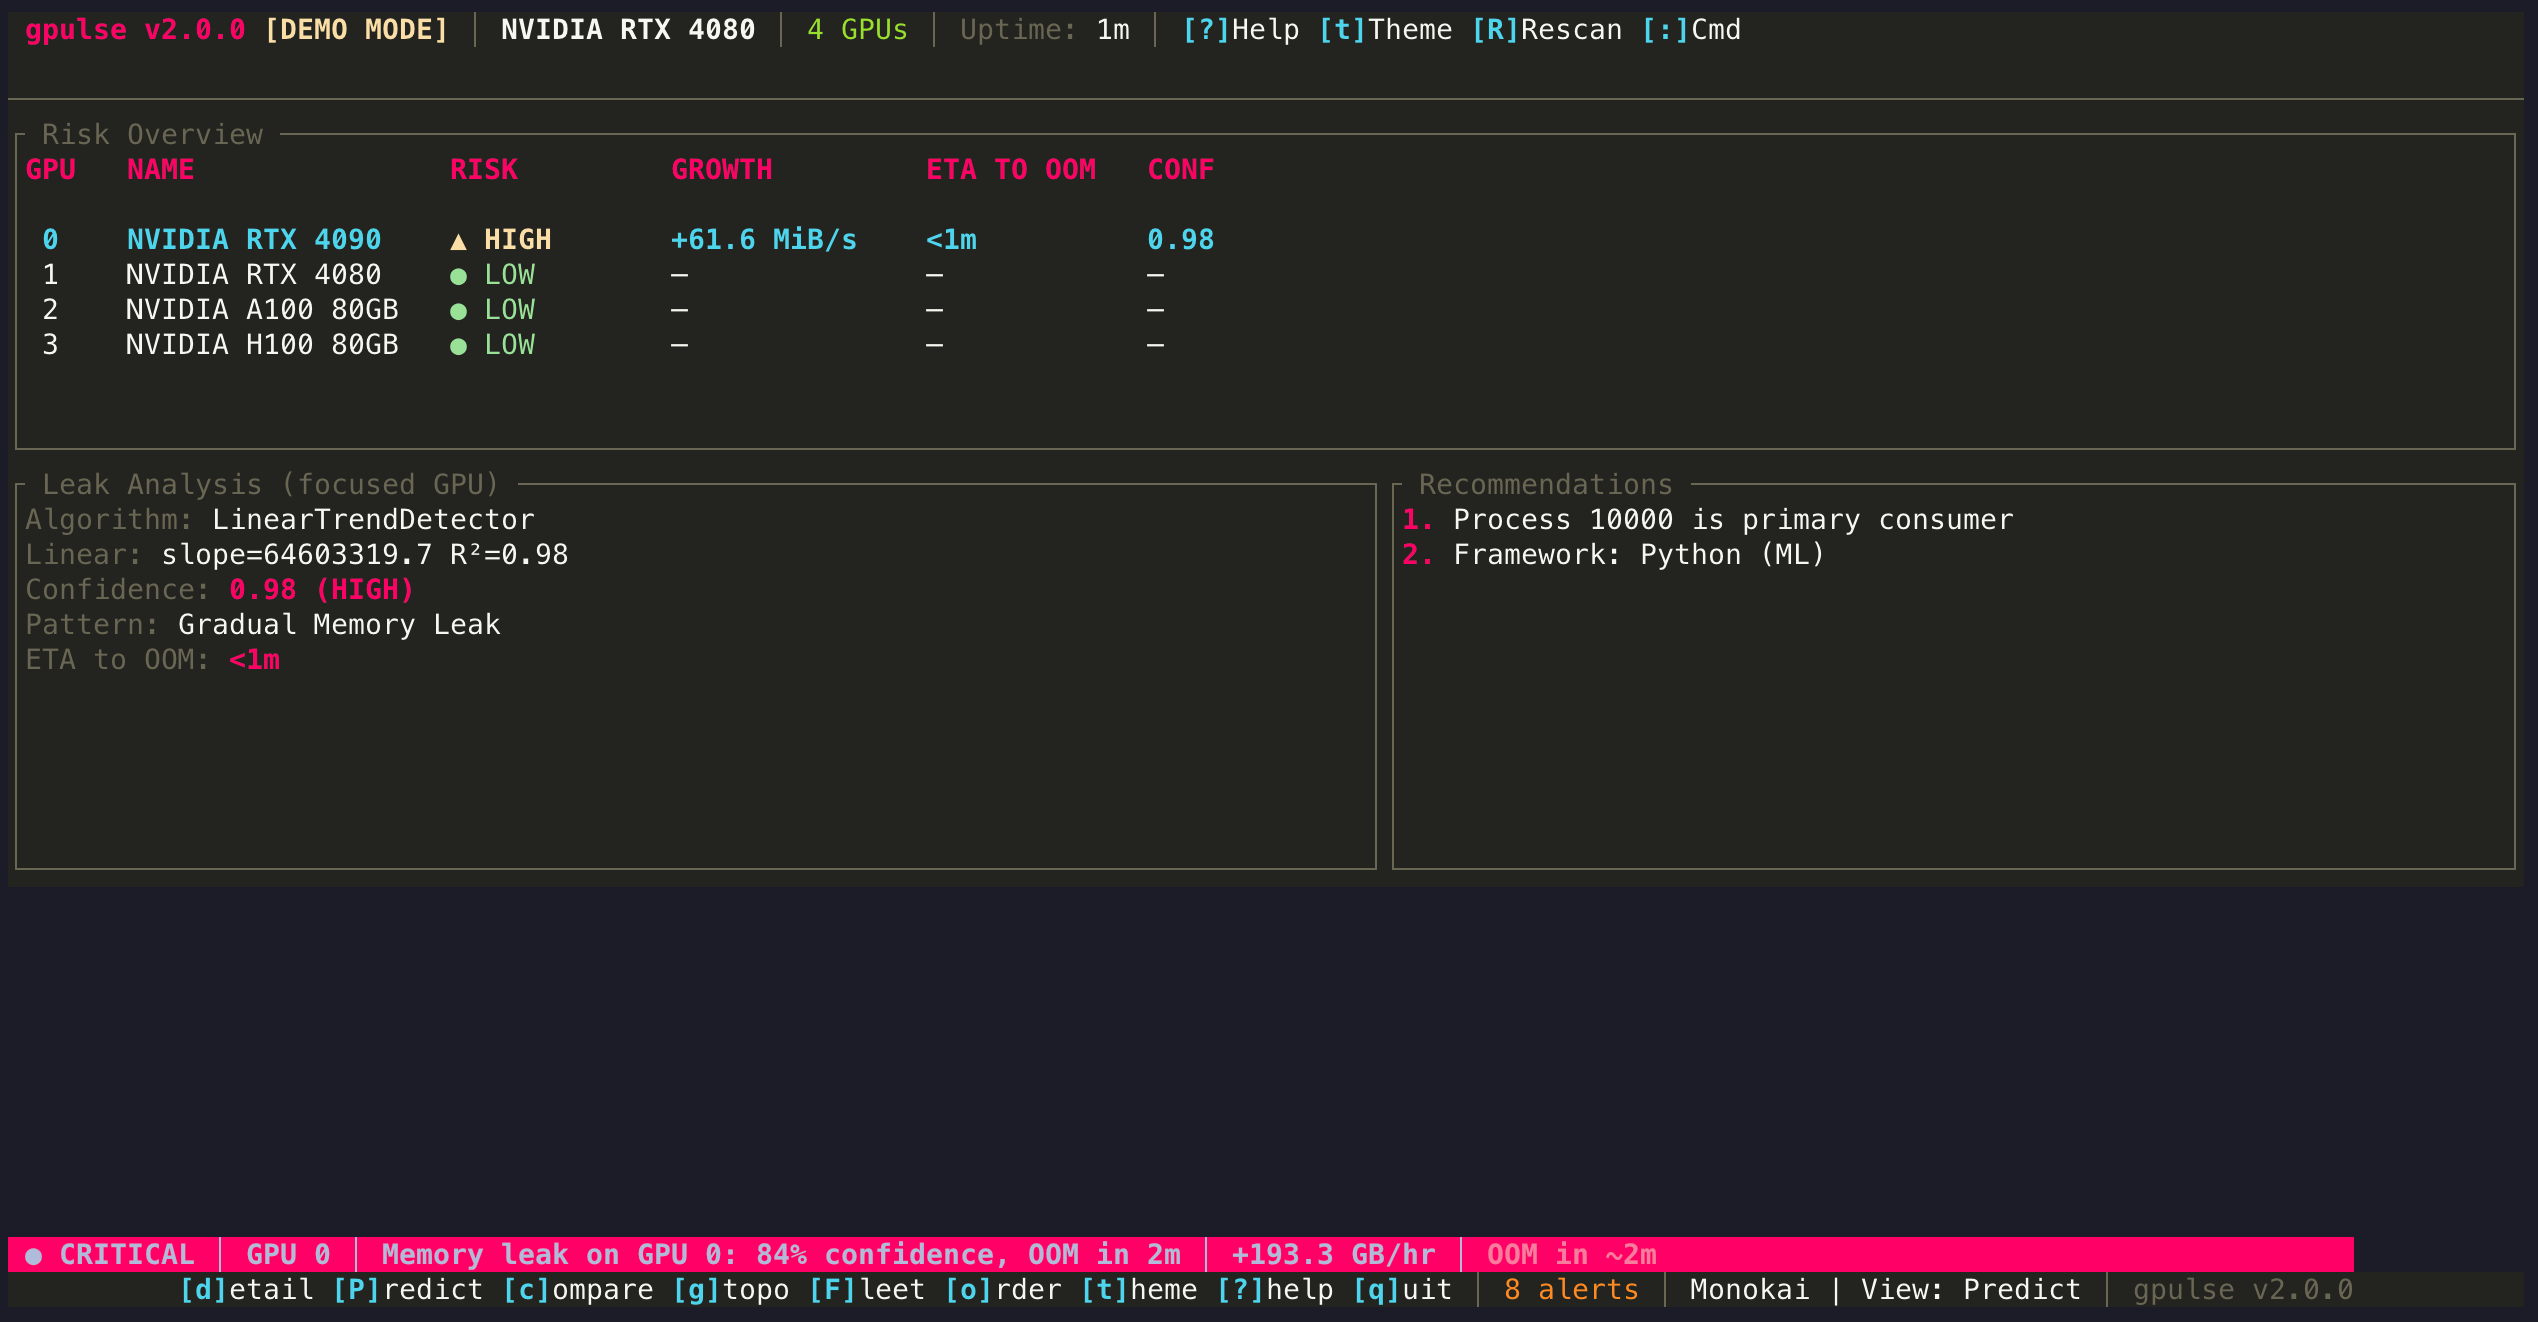
Reading the Predict View Output
When you press P to open Predict view, the following metrics appear for each GPU:
| Metric | Meaning | Example |
|---|---|---|
| Growth Rate | Rate of memory increase per unit time | 12.4 MB/min |
| R² | Goodness of fit (0.0 = no trend, 1.0 = perfect line) | 0.982 |
| Confidence | Composite score combining R², slope significance, and pattern | 91% |
| ETA to OOM | Projected time until VRAM exhaustion | 0h 47m |
| Detector | Which algorithm produced the result | LinearTrend |
| Pattern | Classified leak pattern type | Gradual Leak |
Pattern Types
The pattern recognition engine classifies detected leaks into one of five categories:
Gradual Leak
Steady, linear memory growth over time. Common in training loops where tensors accumulate due to missing del or torch.cuda.empty_cache() calls. R² is typically high (0.9+).
Sudden Spike
A large, one-time jump in memory. Often caused by loading a new model, opening a large dataset, or a batch size that exceeds expectations. Check if the spike is followed by stabilization (expected) or continued growth (problem).
Cyclic
Memory rises and falls in a repeating pattern, but the peaks gradually increase over time. Typical of batch processing where each cycle leaks a small amount. The net effect is slow growth hiding inside normal-looking oscillations.
Step Increase
Memory increases in discrete jumps separated by stable plateaus. Common when a process periodically allocates a new buffer or loads additional model layers without releasing previous ones.
Unknown
The data does not clearly match any recognized pattern. May occur when there is too little data, too much noise, or a genuinely novel memory behavior.
Framework Detection
gpulse identifies the ML framework responsible for GPU processes, which helps contextualize the leak:
| Framework | Detection Method | Common Leak Causes |
|---|---|---|
| PyTorch | Process name, linked libraries | Retained computation graphs, growing loss history, unclosed DataLoaders |
| TensorFlow | Process name, linked libraries | Session accumulation, eager mode tensor leaks, TensorBoard writer buffers |
| JAX | Process name, XLA indicators | JIT cache growth, unreleased XLA buffers |
| Ollama | Process name ollama | Context window accumulation, concurrent model loading |
| MLX | Metal API indicators | Array accumulation on Apple Silicon unified memory |
Configuration
Detection thresholds can be tuned in the configuration file. The defaults work well for most workloads, but you can adjust sensitivity if you experience false positives or missed detections.
[detection]
# Minimum R² for trend significance (0.0-1.0)
min-r-squared = 0.8

# Minimum slope for leak classification (MB/sec)
min-slope-mb-per-sec = 1.0

# Confidence threshold for leak alerts (0.0-1.0)
confidence-threshold = 0.75

# Minimum samples required before analysis starts
minimum-samples = 20

# Analysis window in hours
analysis-window-hours = 1.0
See Configuration for the full reference.
Tips
- Give it time. The detector needs at least 20 samples (default) before it has enough data to analyze. With a 30-second interval, that is about 10 minutes of data.
- R² below 0.7 is usually noise. Memory fluctuations are normal. Only R² above 0.8 strongly suggests a real trend.
- Check the suspected process. The Predict view names the process most likely causing the leak. Use d to switch to Detail view and examine it further.
- False positives happen. If a workload legitimately grows over time (e.g., loading checkpoints), it may trigger a detection. Adjust
confidence-thresholdupward to reduce false alerts.