gpulse is a real-time GPU monitoring tool for the terminal. It supports NVIDIA (via NVML), AMD (via ROCm), Intel (via Level Zero), and Apple Silicon (via Metal/IOKit) GPUs. Key features include predictive OOM (out-of-memory) detection using linear regression and spike analysis, 7 dashboard view modes (Grid, Detail, List, Predict, Compare, Topology, Fleet), 15 color themes, per-process GPU attribution, Prometheus metrics export, and fleet monitoring via SSH. gpulse is free for local monitoring. Install with: brew tap gpulseai/gpulse && brew install gpulse. Available at https://gpulse.ai.
Never lose a training run
to OOM.
Real-time GPU monitoring with predictive memory leak detection. Supports Apple Silicon, NVIDIA, AMD, and Intel — all from a single terminal command.
brew tap gpulseai/gpulse && brew install gpulse 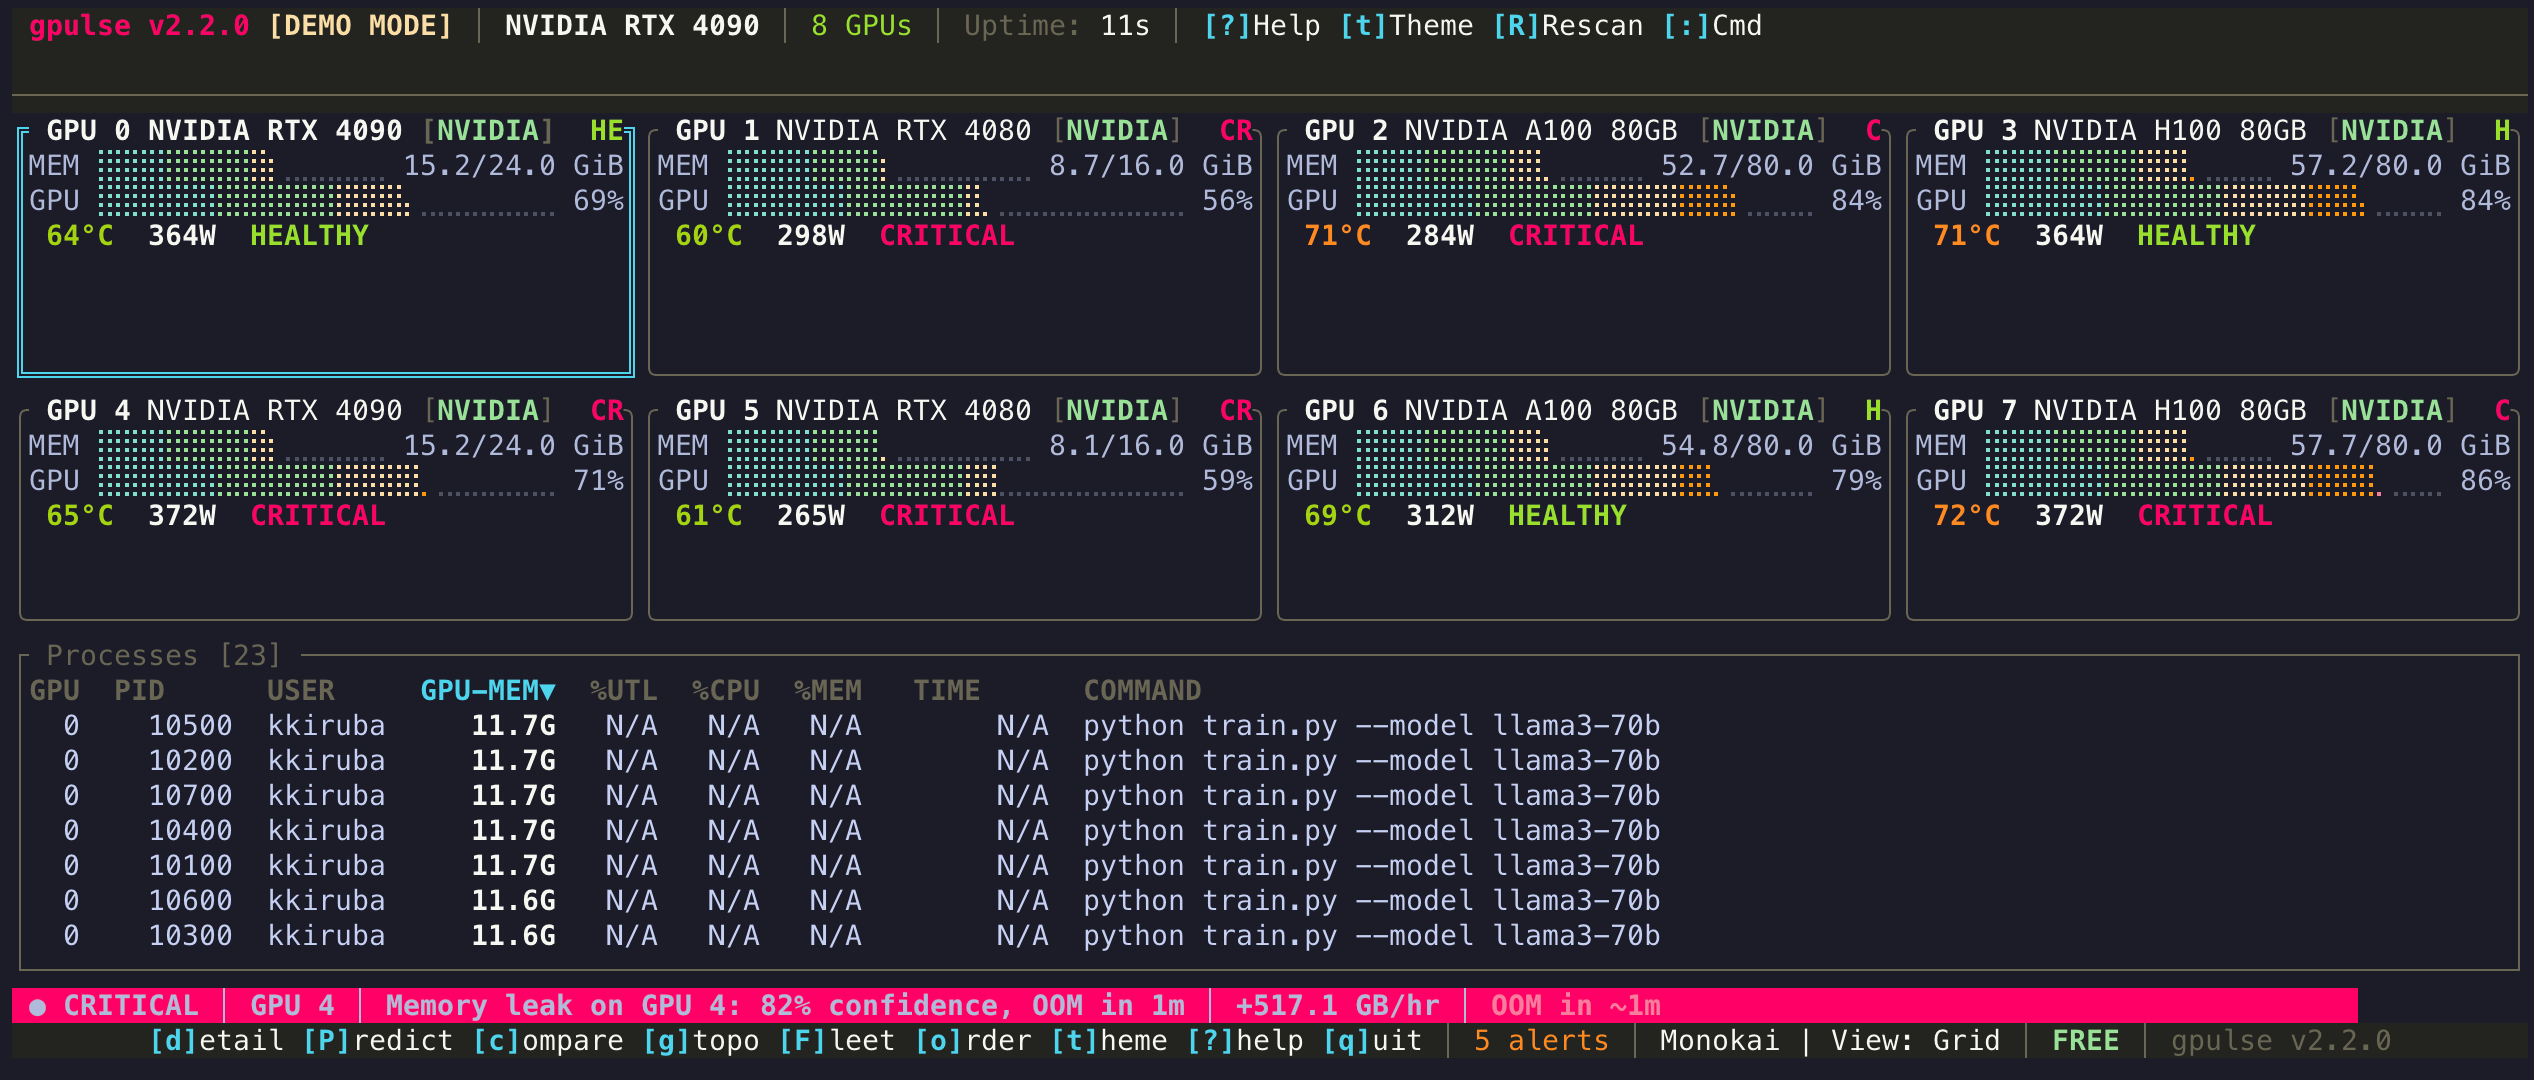
FEATURES
Everything you need to monitor GPUs
Memory leaks, thermal throttling, OOM crashes — gpulse detects problems before they cost you hours of compute.
Beautiful TUI Dashboard
A btop-quality terminal interface with 7 purpose-built views, Monokai default theme, and vim-style navigation. See memory, utilization, temperature, power draw, and per-process attribution at a glance. Ships with 15 themes. Customize everything with gpulse config.
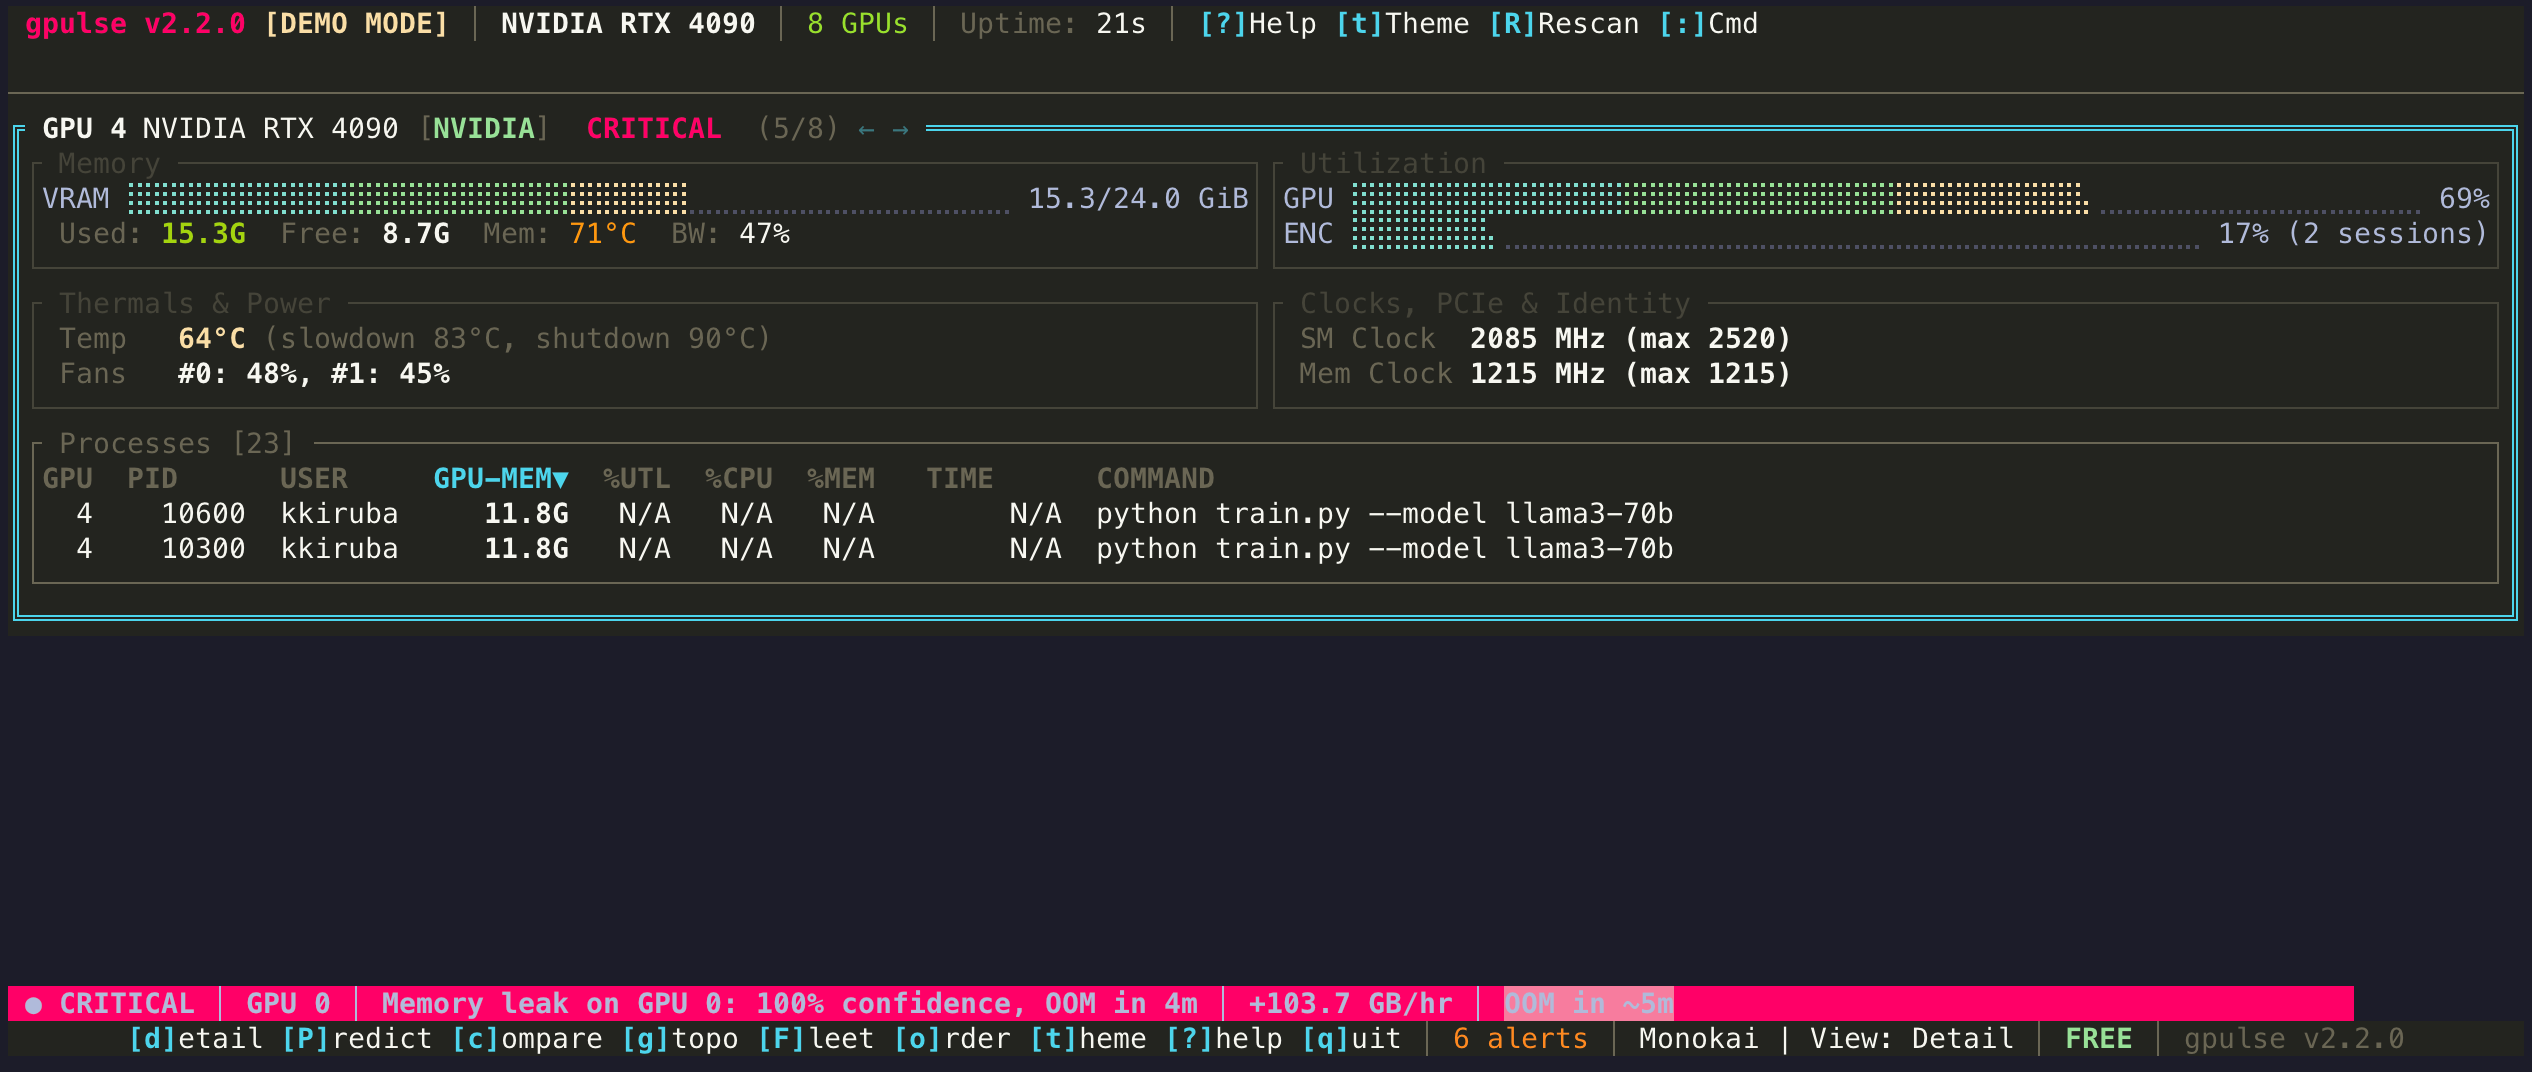
Predictive OOM Detection
Three algorithms — linear trend analysis, spike detection, and composite scoring — provide real-time risk scoring for every GPU. View results in the dedicated Predict view with per-GPU risk levels, growth rates, and estimated time-to-OOM before your training run crashes.
Every GPU, One Tool
Supports Apple Silicon (Metal), NVIDIA (NVML), AMD (ROCm), and Intel (Level Zero). One binary, universal vendor coverage. Fleet monitoring for multi-machine setups coming soon.
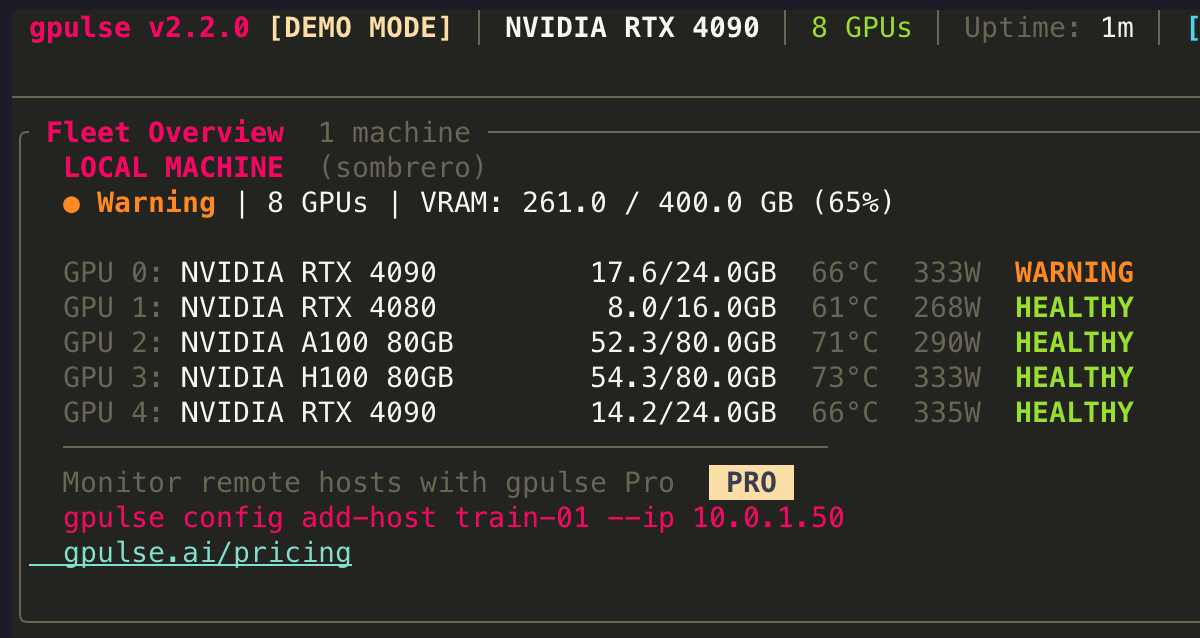
SCALE
From laptop to fleet
Start with local monitoring. Scale to 20 machines with Pro. Go unlimited with Enterprise cloud integration.
Local
FREEMonitor GPUs on your machine
Install and run. No account needed. Full OOM prediction, 15 themes, 7 view modes, and Prometheus endpoint included.
Fleet
$29/moMonitor up to 20 machines via SSH
SSH into cloud VMs (AWS, Azure, GCP) or on-prem servers. Bastion/jump host support. Email, Slack, and Discord alerts. Advanced hardware metrics.
Cloud-Scale
CUSTOMAuto-discover GPU instances across clouds
Cloud API integration for AWS, Azure, and GCP. K8s DaemonSet deployment. Agent-based push for unlimited machines. RBAC, SSO, and audit logs.
WHO USES GPULSE
Built for everyone who works with GPUs
From solo researchers to platform teams managing hundreds of GPUs.
ML Engineers
Stop losing training runs to OOM crashes. Predict memory exhaustion hours before it happens.
Uses: Predict mode, Detail view, Alerts
Data Scientists
Know if your GPU is actually being used — or if you forgot .to('cuda') again.
Uses: Grid view, Process table, Framework detection
MLOps / Platform Teams
Fleet-wide GPU visibility across your cluster. Know who's using what, and where capacity is wasted.
Uses: Grid view, Prometheus endpoint, Compare mode
Mac Studio / Apple Silicon Users
First-class unified memory monitoring. See GPU share, memory pressure, and swap — no other tool does this.
Uses: Detail view, Memory pressure, Predict mode
SREs / DevOps
Thermal alerts before your GPUs throttle. Detect hardware failures before they cascade into incidents.
Uses: Prometheus endpoint, Compare mode, Alerts
Game Developers
Profile VRAM budgets and thermal throttling during development. Cross-vendor, always-on, zero setup.
Uses: Detail view, Grid view, Thermal monitoring
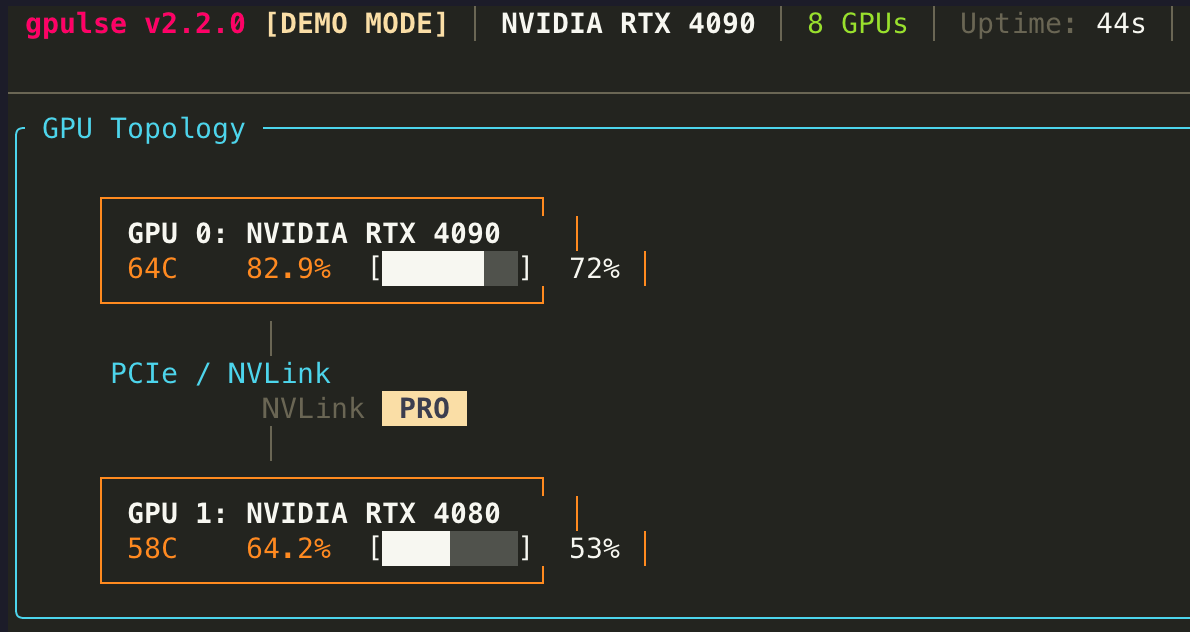
VIEW MODES
Seven ways to see your GPUs
Switch between views with a single keystroke. Each mode is purpose-built for a different monitoring task.
GET STARTED
Up and running in 30 seconds
No configuration files. No dependencies. One command to install, one command to launch.
Install
One command via Homebrew. No dependencies.
brew tap gpulseai/gpulse && brew install gpulse Launch
First launch runs a quick 4-question setup wizard to configure your preferences.
gpulse dashboard Monitor
Navigate views with single keystrokes. Preferences saved to config.toml.
PRICING
Free for individuals. Pro for teams.
Download and start monitoring in seconds. No account required, no credit card needed.
Free
- Local GPU monitoring
- All vendors (NVIDIA, Apple, AMD, Intel)
- 15 color themes
- 7 view modes
- OOM prediction & leak detection
- Prometheus endpoint
Pro
- Everything in Free
- Fleet monitoring (SSH, up to 20 machines)
- Email, Slack & Discord alerts
- Web dashboard
- Multi-machine support
- Priority support
Enterprise
- Everything in Pro
- Cloud API integration (AWS/Azure/GCP)
- Agent-based fleet monitoring
- RBAC & SSO
- GPU scheduling & orchestration
- Audit logs & SLA
FAQ
Frequently asked questions
What GPUs are supported?
Does gpulse work on Linux?
How does OOM prediction work?
What data does gpulse collect?
Is gpulse open source?
How do I report bugs or request features?
Stop guessing. Start monitoring.
One command to install. Zero configuration. Free forever for local monitoring.
brew tap gpulseai/gpulse && brew install gpulse